
Returning customers are the real measure of growth
Why HOPE measures growth by customers who come back, not by ad spend, how to read our numbers with care, and why unit economics must be healthy before we scale.
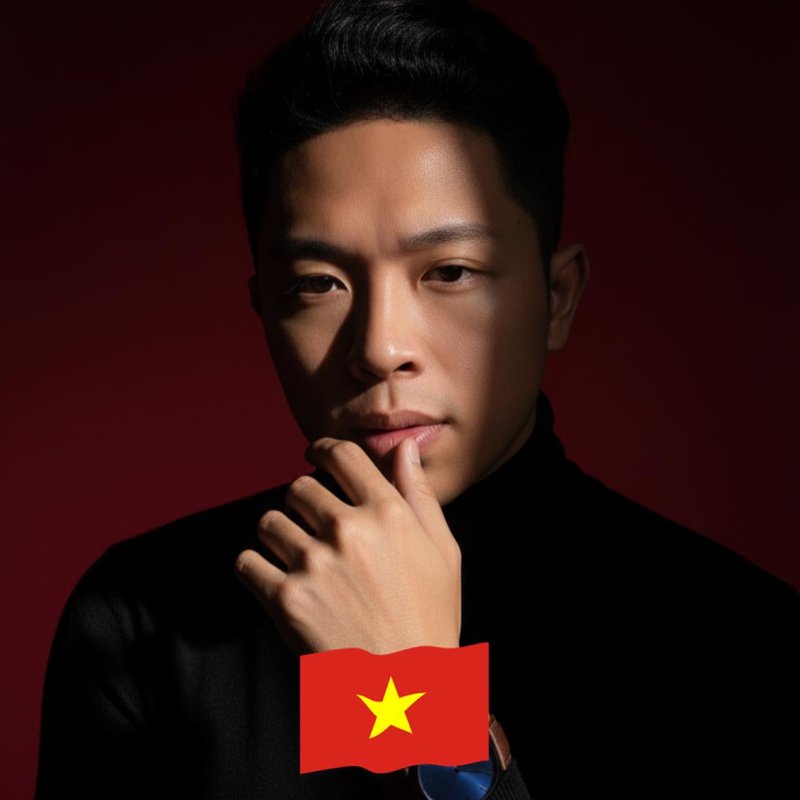 Nguyễn Văn Hưng · Founder, Chairman & CEO — HOPE CORP· 13/10/2026· 5 min read
Once, we nearly put a very attractive number into an internal report: 9,256 leads. It was the total row count of the lead table. When we looked at the distribution by creation date, 9,098 of those rows had been bulk-imported on a single day. Nine thousand people had not found us; one batch import had happened.
Since then we have had a rule: never use a table's total row count as a monthly figure; filter by creation date and look at the distribution. I apply the same discipline to a question that matters more than any view or traffic count: do customers come back? Cumulative revenue is easy to make look good. A customer who returns on her own for a second purchase is hard to fake.
Four numbers, and how to read them honestly
These are the figures we have reconciled against our order log, J&T waybills and bank statements, for March to September 2026:
- 1,294 paying customers (unique phone numbers, retail).
- 40.5% of customers who first bought in March to June 2026 have bought again.
- ~66% of revenue comes from customers who have bought two or more times.
- ~1% of revenue is paid advertising in 2026 (about VND 34 million), roughly VND 26,000 (~US$1) per paying customer.
I am deliberate about stating the limits of each number, so that an investor can see for themselves where the uncertainty is:
- 40.5% is the rate for one group of customers over a window of only a few months. It is not an annual retention rate. Our reconciled ledger starts in 2026; figures for 2023 to 2025 are not reconciled and are not disclosed. Long-term retention is therefore not yet measurable.
- 66% is the share of revenue from multi-purchase customers. It shows that revenue leans on returning customers, but part of it is mechanical: a customer who buys three times is counted three times. Please do not read it as a promise that the share will hold.
- This 66% is a different number from the ~66% revenue share of True Vegan plant protein. Both land near 66%, but they measure different things.
- ~US$1 per customer is paid ad spend divided by paying customers. It is not a fully loaded acquisition cost. The time of our content and care teams, and our software systems, are real costs; they simply do not sit in the ad budget.
With a sample of this size, I regard these rates as early signals, not conclusions.
Why customers return
We have not proven causality. This is how we understand it and what we are tracking, in three connected parts.
A community we own. We have ~240,000 followers across platforms and ~9,700 members in our Zalo groups. Customers come mainly without ads: they have read, asked and heard from others before they buy. People who arrive that way tend to arrive with more accurate expectations.
Content that does not over-promise. Our products are dietary supplements, and our content makes no medical claims. We took down hundreds of older posts to comply with Vietnam's 2026 advertising rules for supplements. In this industry, an exaggerated promise can bring a customer in once and send her away before the second purchase. Keeping our words at the right size is the cheapest way to keep buyers.
Care without poaching. Our lead-routing system follows one principle: whoever's customer it is, looks after her. Care is measured by real messages, not by button clicks. A customer is never pushed to buy by two people at once. On speed: over the 30 days to 10 October 2026, median response time to customers was 1 minute, and 80% of messages were answered within 15 minutes. AI drafts the replies; a staff member approves them before they are sent.
I do not claim that a fast reply by itself creates repeat customers. What I believe, and what is easier to test, is the reverse: a customer who waits a long time and is chased by several people is unlikely to buy a second time.
Unit economics before scale
Our gross margin is about 60-65% after gifts and shipping; product-level margin on realized prices is 66-79% (protein ~79%, coffee ~66%). Net revenue for the first nine months of 2026 was about VND 3.57 billion (~US$137K); the average over the last three months is ~VND 364 million per month, a run-rate of ~VND 4.4 billion per year (~US$170K).
The arithmetic I care about is simple. When a customer buys a second time, we do not pay again to acquire her, so more of the gross margin stays with us. A healthy gross margin, plus customers who return on their own, plus low ad spend, is a sound unit economy at small scale.
Small scale is the operative phrase. I want to say plainly what we do not know: we have not shown that paid channels can scale with good returns, because we have not spent much on them. That is why I will not use investor money to burn on advertising first. Even in operations, AI has no authority to raise ad spend: autopilot is off by default, and every increase is capped at VND 1 million per day.
The concentration risk must also be said out loud: True Vegan protein is ~66% of revenue. If customers come back mainly for one product line, that healthy unit economy is thin. Diversifying through Beauty Meal, tea and cosmetics is work we must do, and we must measure it with this same yardstick.
Market, positioning and the Pre-seed round
IKI is positioned as a beauty-from-within and wellness ecosystem for Vietnamese women: plant-based nutrition products as a daily ritual, the IKI Academy for nutrition knowledge, and the IKI Beauty app personalised with AI. The beauty and wellness market for Vietnamese women is large enough: our TAM is estimated at ~US$9 billion (2025), derived from Global Wellness Institute data; our SAM is about US$0.5 billion, covering ~6.2 million urban women aged 25-44 who buy online and through communities. These are estimates, not revenue. Our three current nutrition products are market tests; a beauty line is the main expansion.
We are raising a Pre-seed round of US$250,000 for 20% equity (US$1.0 million pre-money), and it goes to three things only:
- 40% (US$100K) scaling the IKI brand: content, community, identity and channels.
- 30% (US$75K) new product R&D, focused on a beauty line and finishing our key nutrition product.
- 30% (US$75K) sales: a sales team, official e-commerce stores and repeat-customer programmes.
None of it goes to buying customers through advertising. Each stage has a pass-or-fail gate on repeat-purchase rate; if we do not pass the gate, we do not expand.
What I hope investors take away
I am not asking investors to believe in a growth rate. I am asking them to look at what is harder to fake: a group of paying customers, a meaningful share of whom come back on their own; a gross margin of ~60-65% after gifts and shipping; and ad spend of about 1% of revenue. These numbers are early, the sample is small, and we have no long-term retention data. But they are enough to say that the foundation is healthy, before we add floors on top of it.
Scaling an unhealthy unit economy only makes losses arrive faster. Scaling a healthy one is growth.
AUTHOR
Nguyễn Văn Hưng
Founder, Chairman & CEO — HOPE CORP
Founder-operator who built HOPE CORP into an AI-operated D2C HealthTech company: a 12-person team, a three-layer AI system, 60%+ of work automated; member of Anthropic's Claude Startups. B.Sc. in Information Science, Sojo University (Kumamoto); 12+ years inside Japanese companies (FPT Software Japan, Scuti Japan), from BrSE to business manager; currently pursuing a Master's in Economic Law.
View full profile →ARTICLES
What the capital is for: equity for brand and people, debt for goods
Why HOPE spends equity on brand, new products and sales capability, while working capital for inventory comes from borrowing and the company's own cash flow.
Nguyễn Văn HưngFrom Peeling Onions in Kumamoto to Building HOPE: What I Carried With Me
From a short-weighed shift in Kumamoto to HOPE CORP's AI agents: a founder's real story, and what he looks for in investors and partners.
Nguyễn Văn HưngHolding the Whole and Doing the Detail: Three Layers of AI in a Small Team
A question about weekly AI quotas led to how HOPE is organised: a coordinating agent, department agents, detail agents, cross-cover, and where people sit.
Nguyễn Văn HưngThis content shares business operating experience. IKI products are dietary supplements; they are not medicines and do not replace medical treatment.